Category Archives: Uncategorized

Shared Piloting Facilities – Episode 1: Bio Base Europe Pilot Plant (BBEPP)

Introduction

As explained in the previous blog post, I will look closely to the role of ‘shared piloting facilities’ in the biobased innovation system. Table 1 provides a selection of such facilities that currently exist within Europe. This article will focus entirely on the Bio Base Europe Plant in Ghent.

All information on this facility was derived from a very detailed assessment report resulting from the multi-ket-pilot-lines project: 

http://www.mkpl.eu/results/demonstrators/

Table 1: Selection of shared piloting facilities

Bio Base Europe Pilot Plant Ghent, Belgium / Terneuzen, NL
CPI UK
Bio-economy pilot line Aalto, Finland (VTT)
Chempolis Ltd Oulu, Finland
ARD Agro-Industrie Recherches et Développements Reims, France
CBP Center for Chemical-Biotechnological Processes Leuna, Germany (hosted by Fhf)
Bio Process Pilot Facility Delft, the Netherlands
Biorefinery of the future / SEKAB Örnsköldsvik, Sweden (hosted by SP)


Specific questions to be answered

  • What role do these shared piloting facilities play in the Eureopan biobased innovation system?
  • What are the best practices and lessons learnt with respect to these facilities?
  • How do these (combined) facilities connect to the (future) role of AERTOS RTOs?

Topics to be covered

  • History
  • Purpose
    • Services provided
    • How does it fit within the ecosystem
  • Technology, Equipment
    • Overview
    • Unique selling point
  • Organisation, Staff, Business, Finance
    • Ownership
    • Business Case / Funding (public / private)
    • Client base / Market perspective
  • Lessons learnt
    • Best practices
    • Do’s and dont’s


History

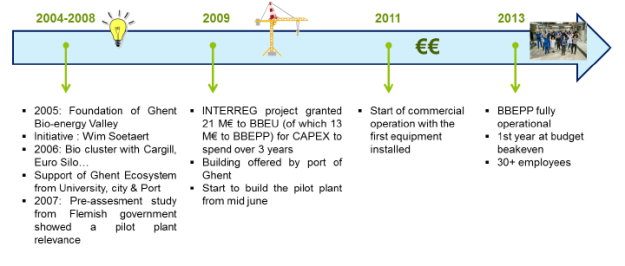
Bio Base Europe Pilot Plant is a not-for-profit organization located in Ghent, Belgium. It officially started up as part of a 2009 INTERREG IV European project, together with the Bio Base Europe Training Centre located in Terneuzen, The Netherlands.

The plant is located in the port of Ghent in a former fire station. It has been converted into a biochemical transformation facility with an analytical lab and 3 different process halls of over 1700 m2, equipped with state-of-the-art equipment. Most of the equipment and utilities were installed between 2009 and 2011. The plant became fully operational in 2012.

history

Purpose

The facility is “open” to customers without restriction (within the limits of their business model and operating procedures). As such Bio Base Europe Pilot Plant is a multi-user “pilot plant”, or scale up facility. A mix of industrial and academic customers can access the facility in order to close the gap between scientific feasibility and industrial application of new biotechnological processes.

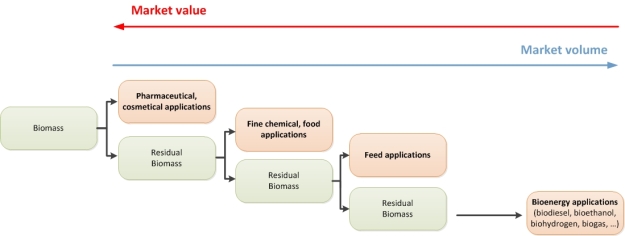
The focus lies on biochemical conversion of abundantly available 1st generation substrates to high added value molecules and converting second generation substrates such as agricultural waste products and non-food crops into renewable products like biofuels, bioplastics, biosolvents.

BBEPP positions itself as a one-stop-shop meaning that it covers the entire process chain in a single plant, from the biomass up to the final bio product. All equipment needed is available in one place, from upstream to downstream and from lab-scale to pre-industrial scale. To allow for flexibility, each piece of equipment is modular, put on a skid and many are placed on wheels to allow for re-positioning according to the configuration desired by the customer.

The services provided are mainly focused on two deliverables: delivery of the physical end product and the transfer of know-how concerning the process. The know-how is detailed in a full set of documentation which includes elaborate reports, protocols, mass balances and equipment specifications that constitute a complete technology transfer. The protocols, the list of tasks and deliverables, the timing, price and reporting are discussed when setting up the partnership.

Technology, Equipment

Bio Base Europe Pilot Plant is a facility that operates using diversified process equipment from kilogram scale to ton scale as a service for the development of the bio based economy. The pilot plant allows its customers to assess specific strengths and weaknesses of new biotechnological processes before making costly, large-scale investments. The development services provided are positioned between late stage research and pre-market industrial development (TRL 4 to 7).

Bio-based processing is typically a series of individual process steps that are executed in different equipment or vessels. In a full scale production bio-refinery, the production vessels are positioned one after the other in the sequence of the process steps. In the development phase at the pilot plant, the sequence of processes can vary according to specific needs of the various starting materials and the end-products. Thanks to the high degree of modularity and the completeness of the equipment set, BBEPP can market themselves as a one-stop shop.

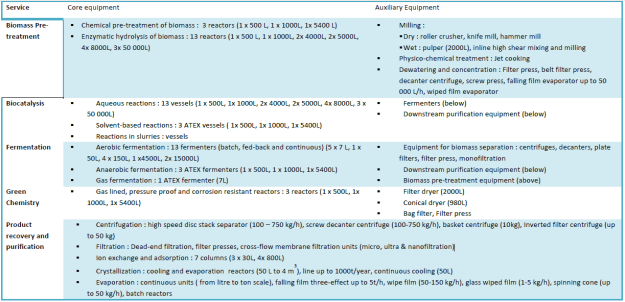
BBEPP is equipped with modular, multi-purpose, industrial equipment to cover a broad range of bio-based processing for industrial applications. At the start of BBEPP, a specific budgetary envelope was reserved for the purchase of the required equipment and installation. Table 3 provides a list of equipment specifications.

Table 3: List of equipment

equipment 1

equipment 2

Organization and staff

The key supporting agencies / partners at the start of BBEPP include:

  • Ghent Bio Economy Valley, the local bio base cluster
  • The port of Ghent, where BBEPP is located
  • The city of Ghent, the Province of East Flanders
  • Enterprise Flanders and IWT (agency for innovation by science and technology), regional funding agencies that support BBEPP
  • The University of Ghent, where BBEPP does a large part of its scientific resourcing.

These entities supported BBEPP from the start and are still guiding its business plan as board of directors. These partners are public agencies, making therefore BBEPP independent from any industrial company. BBEPP makes sure that it is not serving one big unique customer in order to keep its independence. At the time of writing (2013) the facility had a staff of 35-40 persons. The team was split between administration, finance staff (6 persons), Business development & communication (2 persons), research & development (20 persons) Operations, Maintenance and Engineering (9 persons). At the beginning, a larger share of the staff was made up of engineers and operators dedicated to the installation of the equipment.

Business and finance

BBEPP was a publicly funded organization at the outset, but with “one-shot” capital subsidies. In total, the BBE project received around 13 M€ of public funding from European Union (via INTERREG), East-Flanders, and Ghent. (With a total budget of 21M€, 13M€ went to Bio Base Europe Pilot Plant and 8 M€ to Bio Base Europe Training Centre.) The year 2013 was BBEPP’s first year of operational break even with a budget of 4.6M€. On the side of the expenses, almost 2.8 M€ were due to equipment and infrastructure depreciation, utilities and maintenance and more than 1.7 M€ for staff expenses.

With respect to income, BBEPP keeps a balance of (50%/50%) between public and private contracts. In 2013 the BBEPP received almost 1.9 M€ in private contracts. Of this amount, approximately two thirds came from large enterprises, which represent 1/3 of BBEPP customers. Only one third of contract revenue was from SMEs, which represents 2/3 of BBEPP customers. About 75% of BBEPP clients are situated from a radius of 200km.

The most important value-added for customers is accessing faster manufacturing learning curves and quicker time to market. The industrial outcome is equally split between the setting up of a new production line and the optimization/ adaptation of an existing on (medium and large enterprises). For start-ups and SMEs, scale-up often enables the company to test stabilized products with potential customers, triggering possible contracts and engagement, which is an essential step before convincing an investor to pour money into a new production line. The typical contract for a large enterprise is around 100k-200k€, whereas for an SME it goes from 5k€, with an average around 25 k€. Sharing fixed costs is part of BBEPP’s value proposition. In comparison, the cost of building up one’s own pilot would typically cost between 500 k€ and 5 M€.

After five years of operation, BBEPP was able to cover its annual operating costs with contract revenue. However, depreciation cost are not covered by contracts, so upgrades or investments in new capital equipment and facilities are not possible without assistance from external bodies, either public or private. BBEPP will certainly need a regular public funding of CAPEX to be sustainable in the future as non-profit regulations do not allow BBEPP to build up capital from revenues year over year to be able to invest in new equipment.

Lessons learnt

The following section lists some key lessons learnt that were developed as part of the on-going activities:

There is added value in building up and sharing non-proprietary know-how

The most significant distinguishing characteristic of BBEPP with respect to the competition is its high level of expertise in industrial biotech. BBEPP develops and tests processes as a typical contract manufacturer would do, and in addition shares and transfers non-proprietary know-how as a major part of the added-value delivered to industrial customers and academic partners alike.

Maintaining know-how

BBEPP is developing process know-how in the bio-based industry, thanks to its staff expertise and is keeping it “state-of-the-art” thanks to public R&D projects and experience with customers’ scale-up runs. This know-how is transferred to customers. This is differentiating the shared facility proposition from contract manufacturing (i.e. by competitors).

Serving multiple ecosystem functions

Today the facility is running on the basis of a combination of publically financed R&D projects and industrial contracts, covering a broad range of customers and markets. This mix of projects is critical for serving a variety of ecosystem functions. For example:

  • Public projects give BBEPP the necessary visibility to attract potential private customers. Most private customers of BBEPP do not want to communicate on their experiences.
  • With respect to private customers, large enterprises are essential for financial sustainability. These customers can finance 100kEUR plus projects necessary to stay in business.
  • The facility serves a majority of SMEs. An interesting lesson is the so called “coupon scheme”, which provides start-ups with a 10-30k€ voucher, sponsored by a government, for a scale-up experiment at BBEPP. These dedicated subsidies enabled BBEPP to offer its services to start-ups.

Independence, IP and confidentiality as key boundary conditions

From the beginning of the project, BBEPP chose to be independent of any industrial shareholders. Thus, BBEPP can work equally with any company. For certain companies, it ensures that their know-how will not be taken and used by a competitor. For the public funding agencies of BBEPP, it ensures that their investment will be used equally by SMEs, and big companies with no preferences towards a specific consortium of enterprises. BBEPP generally grants industrial property rights developed along projects to its customers. The customer requirements for confidentiality continually increase as the activity moves closer to market. Therefore service agreements with customers include confidentiality clauses and BBEPP generally does not take any IP. Of course this is more limited in the case of public-funded projects where transparency and openness are required.

Staff

The hiring process for a new structure like BBEPP is difficult: it is crucial to find the right people, and a good mix between young inexperienced but enthusiastic people and experienced process engineers. Contacts with universities and other academic partners were used to find new candidates, as well as networking and word of mouth.

Equipment acquisition

Based on experience and estimations, a list of equipment to acquire was made, this equipment was assessed to cover the needs of future customers, this is an estimated guess. For certain unit operations, second hand equipment was selected instead of new equipment in order to keep the overall project within budget and still to be able to offer a “one-stop shop” concept. Modular equipment enable its staff to offer quickly customized testing to its customers. The next step for BBEPP to take would imply bigger equipment aiming for custom manufacturing. This would be the last scale-up step for big volume industries, with the ambition to cover developments beyond TRL7 to TRL8 (enabling final scale product demonstration), and would enable custom manufacturing services, which could represent a base revenue stream for BBEPP.

Without multiple funding sources, BBEPP would not have been possible.

The initial investment in capital needed to create a pilot plant of meaningful size is significant. A pilot facility needs a large set of equipment and skilled people to run the pilot processes. A facility like the BBEPP has substantial fixed costs, so critical mass and size is key to being both viable and effective. At the time of inception of BBEPP, no single government funding agency had the programmes or measures in place to support such an initiative. BBEPP was made possible by combining various sources of public funding. Even today, despite the facility covering its operational costs, capital and equipment depreciation are not covered by contracts, so upgrades or investments in new capital equipment and facilities will not be possible without finding additional capital injections.

Agro-food sector requirements

The agro-food sector demands special quality requirements, particularly in terms of norms and standards. Though BBEPP is already addressing the scale-up of sub-products for the agro food industry, scaling-up final product for this sector requires standardized quality processes. BBEPP is currently working on getting approved for this sector in order to address a broader range of customers.

Biorefinery Pilot & Demo landscape

At the core of the currently existing biobased innovation system, we find a pluriformous landscape of pilot & demonstration facilities. This landscape stretches out across Europe and the rest of the world. For biobased innovators, there is a strong call for even more of such ‘steel’, lest we lose the race to capture the upcoming market for sustainable biobased products and applications.

Some of these facilities are like lighthouses pointing to biobased industrial achievement: signposts to a distant future where biorefineries will have replaced steam crackers. Some of these facilities are more akin to ship wrecks, pointing out hazardous waters of technological failure and financial ruin.

We started out this explorative study as an attempt to provide an overview of this landscape and to derive lessons learnt from past experiences.

lighthouse

Scoping and research questions

So-far this exploration is based on merging a combination of existing sources:

In order to bring down the set of projects to a researchable selection, a specific focus was chosen. A first inventory of projects yielded the following categories of special interest from the perspective of the AERTOS consortium:

  • Focus on shared innovation facilities
  • Focus on LC-biorefinery multi-product systems
    • Excluding oligo-chemistry and thermochemical based routes
    • Excluding dedicated ethanol/energy plants

For practical reasons, an additional delineation is to:

  • Focus on initially on plants within Europe.
  • With high TRL level (demo-scale)

The result of this scoping step are presented in Table 1 and Table 2.

Table 1: Selection of state of the art EU demonstration plants

Lenzing Lenzing, Austria Wood refinery
Zellstoff Stendal Arneburg, Germany Wood refinery
Sunila mill (Stora Enso) Kotka, Finland Wood refinery
Borregaard AS Sarpsborg, Norway Wood refinery
SEKAB / Domsjö plant Övik, Sweden Wood (primarily) refinery
Abengoa Bioenergy Multiple pilots / demo’s Agri-LC-refinery
Beta Renewables Rivalta Scrivia /  Crescentino Agri-LC-refinery

Table 2: Selection of EU shared piloting facilities

Bio Base Europe Pilot Plant Ghent, Belgium / Terneuzen, NL
CPI UK
Bio-economy pilot line Aalto, Finland (VTT)
Chempolis Ltd Oulu, Finland
ARD Agro-Industrie Recherches et Développements Reims, France
CBP Center for Chemical-Biotechnological Processes Leuna, Germany (hosted by Fhf)
Bio Process Pilot Facility Delft, the Netherlands
Biorefinery of the future / SEKAB Örnsköldsvik, Sweden (hosted by SP)

Guide to the reader

The upcoming blogs will attempt to look closer to these two lists of pilot facilities and demonstration plants.

Blog series 1: shared piloting facilities

Specific questions to be answered

  • What role do these shared piloting facilities play in the Eureopan biobased innovation system?
  • What are the best practices and lessons learnt with respect to these facilities?
  • How do these (combined) facilities connect to the (future) role of AERTOS RTOs?

Blog series 2: State of the art biorefinery technologies:

 Specific questions to be answered

  • What are the relevant competing technologies currently ‘out there’ in the market?
  • How are they performing in terms of:
    • Markets served
    • Underlying business case (subsidies / launching customers)
    • What are the best practices and lessons learnt with respect to these facilities?


On the Price of Sugars

A producer of fermentation products can choose feedstocks with different purities (Fig. 1).  As the purity goes up, the price is higher, and processing costs are lower, allowing the producer to define economically optimal conditions.  Both refined white sugar and raw sugar are traded.  White sugar is traded in London at the London Futures Exchange (LIFFE) The contract is known as the No 5 contract and is traded in US$/metric ton.  Raw sugar is traded in New York at the Intercontinental Exchange (ICE) The contract is known as the No 11 contract and is traded in USc/lb.

The charts of the trade prices for refined white sugar and raw sugar can be obtained easily from the following link: http://www.sugartech.co.za/sugarprice/

No published trade prices for feedstocks with lower purities that could be of interest (e.g. molasses, starch, thick beet juice and syrup) have been found.  Without any doubt, if traded, producers of fermentation products should have this information.  In not traded, at least sugar producers know the production cost of purifying the intermediate, from which then a market value can be calculated.

Sugar purity

Figure 1: Feedstock price and processing costs as a function of the purity of different feedstocks (Ref. “Opportunities for the fermentation-based chemical industry. An analysis of the market potential and competitiveness of North-West Europe.”, Deloitte, September 2014).

When analyzing the charts (see Figs. 2 and 3), the following is observed:

Raw sugar (Price in cent/lb.):

The average value varies from 9 cent/lb. in 1991 to 18 cent/lb. in 2016 (determined by using an approximate linear regression).  Actual price (24-feb-16): 14,24 cent/lb.

When converted in $/tn., we obtain the following values: $ 198/tn. – $ 396/tn. – $ 313/tn. (simply multiply by 22).

Trade prices raw sugar

Figure 2: Trading price of raw sugar during the last 25 years (in USc/lb).

White sugar (Price in $/tn.):

The average value varies from $ 275/tn. in 1991 to $ 475/tn. in 2016 (determined by using an approximate linear regression).  Actual price (24-feb-16): $ 405,30/tn.

Trade prices white sugar

Figure 3: Trading price of white sugar during the last 25 years (in US$/Tn).

Combining both charts, by linear regression, we obtain approximately the following values.  The actual value has been included for comparison.


Values in $/tn. 1991 value

(linear regression)

2016 value

(linear regression)

Actual value

(24-feb-16)

White sugar 275 475 405
Raw sugar 198 396 313
Difference 77 79 92

Table 1: Representative values for 1991 and 2016, with the actual value, and comparison between raw and refined white sugar trade values.


Forecast:

In the following report past values and forecasts of up till 2024 are included:

http://www.oecd-ilibrary.org/agriculture-and-food/oecd-fao-agricultural-outlook-2015/evolution-of-world-sugar-prices_agr_outlook-2015-graph84-en

From the tables in the report, the following average values can be calculated (in $/tn.):

 Price in $/Tn. Historic Recent Forecast
NOMINAL VALUES Average 1988 – 2005 Average 2006 – 2016 Average 2017 – 2024
Raw sugar 216,16 385,47 364,41
White sugar 296,12 476,65 441,93
Difference raw / white 79,96 91,18 77,52

Table 2: Average trade prices in the past (1998 – 2005 and 2006 – 2016) and forecasted (2017-2024), including a comparison between raw and refined white sugar trade values.

The forecast value for the period 2017 – 2024 is slightly lower (20 $/tn for raw sugar and 35 $/tn for white sugar) than the average values for the period 2006 – 2016.  If we take into account that these are nominal values, we can speak of a true price reduction for the coming years.


Conclusion:

White sugar, in the last 25 years, has a max. price around 800 $/tn. and a min. price around $ 160/tn. (at this moment raw sugar dropped to 88 $/tn., maintaining the previously mentioned difference).

Therefore, both white and raw sugar have highly speculative trade values.  However, the difference between both remains quite constant, having an approximate value of 80 – 90 $/tn.


Additional Information:

Traded values:

http://www.sugartech.co.za/sugarprice/

Sugar Prices:

https://www.commoditybasis.com/sugar_prices

Sugar and Sweeteners Yearbook Tables:

http://www.ers.usda.gov/data-products/sugar-and-sweeteners-yearbook-tables.aspx

Sugar and Sweeteners Outlook:

http://www.ers.usda.gov/media/2010067/sss-m-330-feb2016-final.pdf

Sugar: World Markets and Trade:

http://apps.fas.usda.gov/psdonline/circulars/Sugar.pdf

OECD-FAO Agricultural Outlook 2015-2024:

http://www.fao.org/3/a-i4738e.pdf

Market opportunities for microalgae-based biorefineries

Algae are small photosynthetic organisms with a relatively large productivity and a small generation time. An exact definition of an alga is hard to obtain as this group covers a large variety of organisms. A rough classification is often made based on the size, separating algae into micro- and macroalgae. Microalgae are situated at the bottom of the food chain. The biochemical compounds they produce are essential for the human diet as well, although microalgae are not often found in the local grocery shops. The production of microalgae species for food supplementation has been commercialized in Asia since decades [1]. The most popular species for this purpose are Spirulina and Chlorella. Due to their large concentration of proteins and useful lipids, they are sold as entire biomass. However, as algae are such a large group of species, a large variety of different beneficial biochemical compounds could be produced. Since only a few of the estimated 72,500 species are commercialized, this large potential remains mostly untapped [2, 3].

Chlorella pills

Figure 1. Chlorella pills

Some microalgae species are known to accumulate relatively large amounts of certain compounds. Dunaliella salina and Haematococcus pluvialis have for example been commercialized for the production of β-carotene and astaxanthin [1]. Other microalgae species can accumulate large amounts of lipids which can be converted into biofuel [4]. If we take the large productivity potential of these species and the fossil fuel problems into account, it doesn’t come as a surprise that the search for a microalgae-based biofuel has received a large amount of attention. Despite all the research which has been performed in this area, an economically viable algae-based biofuel has not yet been commercialized. The large costs related to the cultivation stage combined with the low fuel prices, make this a difficult business case [4]. Combining different applications in a biorefinery concept could be a solution. These applications can be grouped according to their market volume and value, ranging from low value products with a large market volume (e.g. biofuels) to high-value products with a low market volume (e.g. food supplements). The production of both biofuels and high-value food supplements in one biorefinery concept is not feasible due to incompatible market volumes [5]. Moreover, it doesn’t make sense to focus on a low value product, when the same feedstock could be converted and sold for higher prices as fertilizers or feed. This point of view on the commercialization of the different algae components is based on the cascading principle [6].

Cascading principle algae JPEG

Figure 2. A microalgae biorefinery concept based on the cascading principle

A more logic strategy would therefore primarily focus on a broader commercialization of algae products, gradually increasing the scale. Learning effects and new technology developments can be implemented and the costs of microalgae cultivation can gradually decrease which can improve the commercial viability of algae-based biofuel [5]. The algae-based biorefinery would therefore be initiated producing multiple high value products. The algae species which have been commercialized mainly focus on the production of one product. The ideal algae species for a biorefinery may therefore still remain undiscovered. The following three algae species are proposed for the introduction of a microalgae-based biorefinery: Phaeodactylum tricornutum, Nannochloropsis oceanica and Chlorella vulgaris.

Phaeodactylum tricornutum

Like most microalgae species, Phaeodactylum tricornutum produces several pigments to enable photosynthesis. Some of these pigments have been commercialized due to their high value and can therefore play an important role in a biorefinery.


Fucoxanthin

The most abundant high-value pigment produced by Phaeodactylum tricornutum is fucoxanthin. This carotenoid, which is mainly found in brown seaweed, contributes more than 10% to the total amount of carotenoids produced in nature [7, 8]. Peng et al. [8] performed a review of the different beneficial characteristics of this pigment, including anti-oxidant, anti-cancer, anti-obesity, anti-diabetic and anti-photo aging activities [9]. Figure 3 illustrates the chemical structure of fucoxanthin.

Fucoxanthin

Figure 3. Fucoxanthin

Its main application at this moment is as one of the working compounds of dietary pills. Despite his abundance and beneficial effects, fucoxanthin is not yet widely known, which results in a broad range of price estimates: € 183-42,222 per kilogram. Most fucoxanthin is produced from macroalgae, because cultivation is much cheaper. However, the concentration of fucoxanthin can be much higher in microalgae [10].


β-carotene

β-carotene is another pigment produced by Phaeodactylum tricornutum. This carotenoid is the most generally known of all these pigments and is already commercialized by multiple companies, for example by using Dunaliella salina as a feedstock. It is a precursor of vitamin A and therefore also known as provitamin A. Due to its anti-oxidant features, it can inhibit or slow down the oxidation of free radicals or prevent the propagation of free radical chains [11]. Other beneficial effects include preventive effects against cancer [12]. β-carotene is mainly produced as a pigment or antioxidant for nutraceutical and dietary supplement applications [1]. It is used as well as a colorant for animal feed [13].

Beta-carotene

Figure 4. β-carotene

More than 90 % of the total β-carotene production is chemically synthetized [14]. However, a trans-isomer is obtained in synthetic manufacturing. Natural sources produce a mixture of trans- and cis-isomers. As the cis-isomer possesses anti-cancer properties, the price of natural β-carotene doubles the price of the synthetic form [11]. Although this difference in isomer composition is an important factor for market differentiation, it has also been a barrier to market acceptance in the early stages of marketing of the microalgal product [1]. An alternative natural source of β-carotene, which competes with the microalgal product, is the fungus Blakeslea trispora [1]. Nevertheless, the microalgae Dunaliella salina is still the most important natural source for β-carotene [15].

Market prices for the natural β-carotene form range from € 215-2,650 per kilogram [16-19]. The total market volume of β-carotene has been estimated between € 218-272 million, with the natural β-carotene form constituting 20%-30% of the market [1, 15, 17, 20]. The compound annual growth rate has been estimated between +1.8% and +3.1%.

β-carotene has the E-number E160a in Europe. A study by the European Food Safety Authority concluded that the consumption of microalgal β-carotene is not of safety concern, given that the intake is not more than the normal consumption from natural sources (5-10 mg/day) [21]. Current producers of β-carotene from a microalgae feedstock are EID Parry (India), Cognis/BASF (Australia/Germany), Betatene/BASF (Germany), Natural Beta Technologies (Australia), Tianjin Lantai Laboratory (China), Nature Beta Technologies/Nikken Sohonsa (Israel/Japan), Aqua Carotene Ltd (Australia), Pro Alge Biotech (India), Shaanxi Sciphar Biotechnology Co. and DSM (Netherlands) [22].

Lutein/Zeaxanthin

The third pigment which was identified as a potential biorefinery product from a Phaeodactylum tricornutum was zeaxanthin. Zeaxanthin is a less abundant isomer of lutein and its chemical structure is illustrated in Figure 5 [23]. Lutein is a xanthophyllic pigment with antioxidant properties, which structure is illustrated in Figure 6. Lutein is accumulated in the retina of the eye, where it filtrates the blue light and protects the eye against singlet oxygen and radicals. Lutein can have a preventive function against different diseases such as age-related macular degeneration, cataract or skin diseases. However, there still exists controversy over the use of lutein and zeaxanthin as a pharmaceutical for these diseases as the exact mechanism is not yet known [23, 24]. Lutein/Zeaxanthin can be valorized in crystallized or sold in oil suspense. Like the other carotenoids, lutein is not synthesized by the human metabolism and therefore needs to be acquired to the diet [24]. A minimum daily consumption of 6 mg is recommended. The main dietary sources of lutein are green leafy vegetables such as spinach and kale [25]. Another dietary source is egg yolk, which contains a lower amount of lutein but with a higher bioavailability [26]. Zeaxanthin has similar beneficial effects as lutein although it accumulates at a different location in the retina of the eye. The separation of lutein and zeaxanthin is not a straightforward process. Therefore, many researchers report a combined lutein/zeaxanthin value [25].

Lutein

Figure 5. Lutein

Zeaxanthin

Figure 6. Zeaxanthin

Other microalgae species which are known to produce high amounts of lutein are Muriellopsis sp. and Scenedesmus almeriensis [13]. Lutein and zeaxanthin are mainly sold as a feed additive [13]. Other applications are the use as a colorant in cosmetics and as food or pharmaceutical products [27]. Lutein is listed in the European Union as a food additive (E616b) [28]. The price for lutein/zeaxanthin ranges between € 910 and 15,000 per kilogram (based on commercial suppliers). The market size is estimated to be between € 123 and 165 million per year, with a CAGR of 3.6-6.1% [15, 17].

Currently, the main producers are Kemin Foods, which has a lutein-based partnership with DSM and Cognis, which was acquired by BASF. The commercial names of both lutein-based products are FloraGlo (Kemin Foods) and Xangold (Cognis). Both producers use marigold extract as a source of lutein. However, microalgae contain a much higher content of lutein compared to marigold. A relatively easy production process and a more homogenous biomass are other advantages of the use as microalgae as a lutein source. Other possible sources for commercial lutein are egg yolk, corn residues or shellfish. However, the lutein composition and/or bioavailability are lower compared to microalgae as well. A disadvantage of microalgae is the higher cost of algae biomass production compared to alternative sources [29].

Eicosapentaenoic acid

Besides pigments, Phaeodactylum tricornutum produces another valuable product: Eicosapentaenoic acid. Eicosapentaenoic acid, or shorter EPA (see Figure 7), is a polyunsaturated fatty acid (PUFA). Together with docosahexaenoic acid (DHA), it is the main omega-3 fatty acid. A variety of health effects, such as anti-inflammatory effects, anti-cancer effects and beneficial effects for cardiovascular diseases are attributed to omega-3 fatty acids [13]. EPA is a non-essential PUFA as it can be converted from the essential alpha-linolenic acid (ALA). However, this conversion rate is not high enough to meet the daily intake requirements [30].

EPA

Figure 7. EPA

The main dietary source of EPA is fish oil. However, fish do not synthesize EPA themselves, but derive it from the marine microorganisms they consume [31]. Advantages of the production of EPA from microalgae instead of fish oils are the lack of unpleasant odor, the reduced chemical contamination risk and the higher purification potential [27]. The current main source of EPA fish oils is the anchovery fishery. The global EPA and DHA market size is expected to rise, for example due to the rise in demand of functional foods. Therefore, microalgae-based PUFAs, which are currently expensive may have promising market perspectives as the anchovy fishery will not be able to meet these demands alone [1].

Besides food applications, feed applications are promising as well. However, the high production price is still a problem. Another issue is the high fat content of microalgae which can become a problem for salmon feed processing [1]. Moreover, the salmon feed industry would require a minimum supply of 100,000 ton dry algae per year, which requires a large upscaling of current microalgae cultivation plants [1].

Currently, the omega-3 market for food supplements is dominated by large companies, DSM in specific. This can be both and entry barrier as an opportunity for small companies [1]. Pharmaceutical supplements, nutritional supplements and functional food applications account for 72% of the total market volume. Of these three applications, the nutritional supplements are dominating with 59% of total market volume. Pharmaceutical applications are still limited to triglyceride reduction. However, other applications are currently under development [1].

Current producers of algal EPA/DHA are Ocean’s Alive (USA, Nannochloropsis), Flora Health (USA, Schizochrytium), Martek/DSM (USA/NL, Crypthecodinium), Blue Biotech(Germany, Nannochloropsis), InnovalG (France, Odontela), Photonz (New Zealand), Xiamen Huison Biotech Co. (China, Schizochrytum) and Lonza 2010 (Ulkenia) [22].

Prices for algal-based omega-3 oil are higher than for fish-derived omega-3 oil. For human consumption, algal-omega-3 oil has a price between € 70 and € 141 per kilogram. For feed applications a lower price, € 1.32 per kilogram, was estimated by Borowitzka [1]. The market size for total omega-3 oil consumption ranges between 85,000 ton and 190,000 ton and is still growing [1].

Nannochloropsis oceanica

Nannochloropsis oceanica is the second proposed feedstock for an algal-based biorefinery. It can produce several high-value products, like EPA, zeaxanthin, β-carotene, astaxanthin and canthaxanthin.


Astaxanthin

Astaxanthin is a pink-orange pigment which is used in aquaculture to provide the typical color of salmonids and crustaceans [32]. However, as the production of microalgal-based astaxanthin is much more expensive then the synthetic form, the microalgal product cannot compete in this market. Moreover, the advantages of its natural source are not as significant in the feed market as they would be in the food market. Therefore, the microalgal astaxanthin has targeted the nutraceutical market, due to its strong antioxidant properties [1].

Astaxanthin has even more pronounced anti-oxidant properties than other pigments such as lutein or β-carotene [33]. Different health effects such as protection against cardiovascular and immunological diseases and cancer have been attributed to this carotenoid [32]. An overview of the beneficial effects of astaxanthin can be found in the study of Guerin et al. [34]. The most common microalgae species which is used to produce astaxanthin is Haematococcus pluvialis [35]. Figure 8 illustrates the chemical structure of astaxanthin.

Astaxanthin

Figure 8. Astaxanthin

Astaxanthin is mostly produced synthetically [22]. However, the high costs of this synthetic process and the growing demand for natural sources have initiated research for natural alternatives. An alternative natural source for astaxanthin is the red yeast Phaffia rhodozyma [32]. Krill and the yeast Xantophyllomyces dedrorous/Pfaffia rhodozyma are also used to produce small quantities of astaxanthin [36]. Figure 9 gives the range of astaxanthin content over different natural sources.

Astaxanthin content

Figure 9. Average content of astaxanthin in different sources [1]

Astaxanthin is classified as food additive with E number E161j [13]. The price of astaxanthin ranges between € 7,150 and € 8,837 per kilogram for the natural form and between 1,762 and € 2,198 per kilogram for synthetic astaxanthin [16, 19, 34, 37]. The market size for total astaxanthin is estimated between € 176-227 million per year [15, 38]. The natural form of astaxanthin constitutes 5% of this total production [37].

Current producers of astaxanthin as a dietary supplement or food additive are Cyanotech (USA, Hawaii), EID Parry (India), Mera Pharma (US, Hawaii), Fuji Chemical Industry Co. (=BioReal, Sweden), US Nutra (US)/Parry Nutraceuticals (India), AlgaTech (Israel) and Blue Biotech (Germany) [22]. Astaxanthin for coloring applications for aquaculture is produced by Blue Biotech in Germany [22]

Canthaxanthin

The last pigment of the proposed Nannochloropsis oceanica biorefinery is canthaxanthin. Canthaxanthin is a carotenoid as well and has anti-oxidant, neuroprotective and anti-inflammatory activities [39]. The application as chicken feed has been proven to be associated with increased hatchability [40]. Canthaxanthin can also be related to certain anti-cancer functionalities. However, no conclusive results on this topic have been obtained yet [41]. Figure 10 illustrates its structure.

Canthaxanthin2

Figure 10. Canthaxanthin

Canthaxanthin is commercially used to color egg yolk, salmons from aquaculture, and birds. It has been commercialized as a tanning pill, although it has been associated with different negative health effects [42]. Canthaxanthin can be found in fungi, such as cantharelles, but it is produced synthetically as a bulk product [43]. The commercial producers of canthaxanthin are DSM, Novus international (canthacol) and Versele-Laga, which produces can-tax to color birds.

Feed applications are allowed in the EU for cats, dogs, ornamental fish and birds without a maximum amount. The use of canthaxanthin as a feed additive for salmon and trout is allowed with a maximum concentration of 25 mg/kg. For poultry other than laying hens, a maximum concentration of 25 mg/kg is established, where a more strict concentration of 8 mg/kg is allowed for laying hens. Mixing canthaxanthin with other carotenoids is allowed as well, if the total concentration does not surpass 80 mg/kg in the complete feedingstuff [44]. The maximum residual amount in the animal products has been restricted as well [45]. These maximum concentrations are a consequence an unwanted side effect of canthaxanthin, which may form minute crystals in the retina of the eye through a reversible deposition effect at high doses [41, 43]. However, a recent tolerance study by Weber et al. [46] did not find any health problems related to a ten-times overdose of canthaxanthin in poultry feed. Canthaxanthin is classified as feed additive E161g [45].

The price for canthaxanthin ranges between € 528 and € 4,278 per kilogram (based on commercial suppliers). Its market size was estimated at approximately € 90 million per year according to a BCC report and is stagnating [47].

Chlorella vulgaris

The third and last proposed biorefinery uses Chlorella vulgaris as a feedstock. Its main products are lutein/zeaxanthin, canthaxanthin, β-carotene and astaxanthin. Chlorella vulgaris is one of the most popular microalgae species and has been commercialized since decades. It has primarily been produced to be sold as entire biomass. Prices vary between € 89 per kg in the form of dry powder (Phycom, 100% purity) and € 220 per kg in the form of dry pellets of (Blue Biotech, 97% purity).

References:

[1] Borowitzka MA. High-value products from microalgae—their development and commercialisation. Journal of Applied Phycology. 2013;25:743-56.

[2] Guiry MD. How Many Species of Algae Are There? J Phycol. 2012;48:1057–63.

[3] Raja R, Hemaiswarya S, Kumar NA, Sridhar S, Rengasamy R. A perspective on the biotechnological potential of microalgae. Critical reviews in microbiology. 2008;34:77–88.

[4] Hannon M, Gimpel J, Tran M, Rasala B, Mayfield S. Biofuels from algae: challenges and potential. Biofuels. 2010;1:763-84.

[5] Wijffels RH, Barbosa MJ, Eppink MH. Microalgae for the production of bulk chemicals and biofuels. Biofuels, Bioproducts and Biorefining. 2010;4:287-95.

[6] Keegan D, Kretschmer B, Elbersen B, Panoutsou C. Cascading use: a systematic approach to biomass beyond the energy sector. Biofuels, Bioproducts and Biorefining. 2013;7:193-206.

[7] Dembitsky VM, Maoka T. Allenic and cumulenic lipids. Prog Lipid Res. 2007;46:328-75.

[8] Peng J, Yuan JP, Wu CF, Wang JH. Fucoxanthin, a marine carotenoid present in brown seaweeds and diatoms: metabolism and bioactivities relevant to human health. Marine drugs. 2011;9:1806-28.

[9] Zheng J, Piao MJ, Kim KC, Yao CW, Cha JW, Hyun JW. Fucoxanthin enhances the level of reduced glutathione via the Nrf2-mediated pathway in human keratinocytes. Marine drugs. 2014;12:4214-30.

[10] Xia S, Wang K, Wan L, Li A, Hu Q, Zhang C. Production, characterization, and antioxidant activity of fucoxanthin from the marine diatom Odontella aurita. Marine drugs. 2013;11:2667-81.

[11] Guedes AC, Amaro HM, Malcata FX. Microalgae as sources of carotenoids. Marine drugs. 2011;9:625-44.

[12] Dufossé L, Galaup P, Yaron A, Arad SM, Blanc P, Chidambara Murthy KN, et al. Microorganisms and microalgae as sources of pigments for food use: a scientific oddity or an industrial reality? Trends in Food Science & Technology. 2005;16:389-406.

[13] Skjanes K, Rebours C, Lindblad P. Potential for green microalgae to produce hydrogen, pharmaceuticals and other high value products in a combined process. Critical reviews in biotechnology. 2013;33:172-215.

[14] León R. Microalgae mediated photoproduction of β-carotene in aqueous–organic two phase systems. Biomolecular Engineering. 2003;20:177-82.

[15] Del Campo JA, Garcia-Gonzalez M, Guerrero MG. Outdoor cultivation of microalgae for carotenoid production: current state and perspectives. Applied microbiology and biotechnology. 2007;74:1163-74.

[16] Brennan L, Owende P. Biofuels from microalgae—A review of technologies for production, processing, and extractions of biofuels and co-products. Renewable and Sustainable Energy Reviews. 2010;14:557-77.

[17] Markou G, Nerantzis E. Microalgae for high-value compounds and biofuels production: a review with focus on cultivation under stress conditions. Biotechnology advances. 2013;31:1532-42.

[18] Pacheco R, Ferreira AF, Pinto T, Nobre BP, Loureiro D, Moura P, et al. The production of pigments & hydrogen through a Spirogyra sp. biorefinery. Energy Convers Manage. 2015;89:789–97.

[19] Rosenberg JN, Oyler GA, Wilkinson L, Betenbaugh MJ. A green light for engineered algae: redirecting metabolism to fuel a biotechnology revolution. Current opinion in biotechnology. 2008;19:430-6.

[20] Oilgae. Emerging Algae Product and Business Opportunities. 2015. p. 15.

[21] EFSA. Scientific Opinion on the re-evaluation of mixed carotenes (E 160a (i) and beta-carotene (E 160a (ii)) as a food additive. EFSA Journal. 2012;10:67.

[22] JRC. Microalgae-based products for the food and feed sector: an outlook for Europe.  JRC Scientific and Policy Reports2014. p. 82.

[23] Krinsky NI, Landrum JT, Bone RA. Biologic mechanisms of the protective role of lutein and zeaxanthin in the eye. Annual review of nutrition. 2003;23:171-201.

[24] Roberts RL, Green J, Lewis B. Lutein and zeaxanthin in eye and skin health. Clinics in dermatology. 2009;27:195-201.

[25] Perry A, Rasmussen H, Johnson EJ. Xanthophyll (lutein, zeaxanthin) content in fruits, vegetables and corn and egg products. Journal of Food Composition and Analysis. 2009;22:9-15.

[26] Chung H, Rasmussen H, Johnson EJ. Lutein bioavailability is higher from lutein-enriched eggs than from supplements and spinach in men. The journal of nutrition. 2004;134:1887-93.

[27] Pulz O, Gross W. Valuable products from biotechnology of microalgae. Applied microbiology and biotechnology. 2004;65:635-48.

[28] EFSA. Opinion of the Scientific Panel on Food Additives, Flavourings, Processing Aids and Materials in Contact with Food on a request from the Commission related to Lutein for use in foods for particular nutritional uses. The EFSA Journal. 2006;315:12.

[29] Fernandez-Sevilla JM, Acien Fernandez FG, Molina Grima E. Biotechnological production of lutein and its applications. Applied microbiology and biotechnology. 2010;86:27-40.

[30] Siriwardhana N, Kalupahana NS, Moustaid-Moussa N. Health benefits of n-3 polyunsaturated fatty acids: eicosapentaenoic acid and docosahexaenoic acid. Advances in food and nutrition research. 2012;65:211-22.

[31] Cardozo KH, Guaratini T, Barros MP, Falcao VR, Tonon AP, Lopes NP, et al. Metabolites from algae with economical impact. Comparative biochemistry and physiology Toxicology & pharmacology : CBP. 2007;146:60-78.

[32] Higuera-Ciapara I, Felix-Valenzuela L, Goycoolea FM. Astaxanthin: a review of its chemistry and applications. Critical reviews in food science and nutrition. 2006;46:185-96.

[33] Kang CD, Sim SJ. Selective extraction of free astaxanthin from Haematococcus Culture Using a Tandem Organic Solvent System. Biotechnology Progress. 2007;23:866-71.

[34] Guerin M, Huntley ME, Olaizola M. Haematococcus astaxanthin: applications for human health and nutrition. Trends in biotechnology. 2003;21:210-6.

[35] Chu W-L. Biotechnological applications of microalgae. IeJSME. 2012;6:14.

[36] Rodriguez-Saiz M, de la Fuente JL, Barredo JL. Xanthophyllomyces dendrorhous for the industrial production of astaxanthin. Applied microbiology and biotechnology. 2010;88:645-58.

[37] Spolaore P, Joannis-Cassan C, Duran E, Isambert A. Commercial applications of microalgae. Journal of bioscience and bioengineering. 2006;101:87-96.

[38] Lorenz RT, Cysewski GR. Commercial potential for Haematococcus microalgae as a natural source of astaxanthin. Trends in biotechnology. 2000;18:160-7.

[39] Chan KC, Mong MC, Yin MC. Antioxidative and anti-inflammatory neuroprotective effects of astaxanthin and canthaxanthin in nerve growth factor differentiated PC12 cells. J Food Sci. 2009;74:H225-31.

[40] Rosa AP, Scher A, Sorbara JO, Boemo LS, Forgiarini J, Londero A. Effects of canthaxanthin on the productive and reproductive performance of broiler breeders. Poult Sci. 2012;91:660-6.

[41] Baker R. Canthaxanthin in aquafeed applications: is there any risk? Trends in Food Science & Technology. 2002;12:240-3.

[42] O’Leary RE, Diehl J, Levins PC. Update on tanning: More risks, fewer benefits. J Am Acad Dermatol. 2014;70:562-8.

[43] Breithaupt DE. Modern application of xanthophylls in animal feeding – a review. Trends in Food Science & Technology. 2007;18:501-6.

[44] European Commission. List of authorised additives in feedingstuffs published in application of Article 9t (b) of Council Directive 70/524/EEC concerning additives in feedingstuffs. Official Journal of the European Union. 2004;50:144.

[45] European Commission. Commission regulation (EC) No 775/2008 of 4 August 2008 establishing maximum residue limits for the feed additive canthaxanthin in addition to the conditions provided for in Directive 2003/7/EC. Official Journal of the European Union. 2008;207:2.

[46] Weber GM, Machander V, Schierle J, Aureli R, Roos F, Pérez-Vendrell AM. Tolerance of poultry against an overdose of canthaxanthin as measured by performance, different blood variables and post-mortem evaluation. Animal Feed Science and Technology. 2013;186:91-100.

[47] BCC research. The Global Market for Carotenoids. 2008. http://www.bccresearch.com/market-research/food-and-beverage/carotenoids-market-fod025c.html


RTOs and the Industry

Scenario Pathway 7: Green Enablers

20151214 Green Enablers

In this pathway, the dominant logic is that of Environmental Sustainability, meaning that RTOs’ mission is to support industry’s efforts to transition to more environmentally friendly technologies, products and systems.

The green paradigm of the RTOs is based on Life Cycle Analysis. While politics and values drive the environmental movement at higher levels, RTOs seek to provide a sound scientific basis upon which industry can make technology development and investment choices.

RTOs do have a political role, as they are expected to act as Leaders with respect to environmental technology, rather than responding to industry demand. Only in some cases is this expectation accompanied by additional public funding to provide flexibility for the RTOs, but in all cases, RTOs are backed by political credibility and work closer with governments on environmental technology issues.

The most important policies for RTOs are Green Innovation Agendas. Though ‘market pull’ instruments are generally technology-neutral, ‘technology push’ agendas are developed in many countries looking to develop robust R&D portfolios. RTOs are perceived as particularly knowledgeable in the bioeconomy and have an important role in shaping the Bioeconomy Innovation Agendas.

In line with the goal of large-scale fossil substitution, the RTOs employ the technological paradigm of Footprint Reduction. To the RTOs this paradigm means that novel environmentally-friendly technology systems must compete with technologies to reduce the impact of existing large-scale technology systems. Technology potential is explicitly evaluated with respect to political goals for CO2 reduction and resource efficiency.

Markets in innovation services see Advantages for Public Entities and both RTOs and universities are attractive to industry based in part on their linkages to government environmental policies and implementing agencies. The ability to sustain work over longer time frames is another key advantage for these entities.

Value chains in the industry create a Flow of Research Opportunities for RTOs, as innovation agendas filter through to different actors in the value chain, and new actors successively identify opportunities for footprint reduction.

Scenario Pathway 8: Bio Workshop

20151214 Bio Workshop

In this pathway, the dominant logic is that of Competitive Innovation, and RTOs seek to support industry clients in their efforts to secure competitive advantage in the emerging bioeconomy.

For RTOs the green paradigm has shifted towards Green Consumption, as the driving force for adoption of bio-based processes and products is early adoption by green consumers and public procurement.

The political expectation is that RTOs can function as effective, competitive Consultants to industry, and to a lesser extent to governments. RTOs are expected to be responsive to the marketplace and help advance the innovations that appear most promising to their clients and deliver growth to Member State economies.

In terms of policies, this pathway sees Commercial Agendas dominating the innovation space. Policy is focused on opening markets, both domestic and abroad, and RTO activities are pushed down the innovation chain while primary and pre-commercial research is undertaken at universities.

As RTOs and industries search for the bioeconomy’s higher margin opportunities, the emerging technological paradigm is focused on High-Performance products. Properties and functionality are considered more defensible advantages than cost, and chemicals and specialty materials from bio-based feedstocks are prioritized when they can be sold as functionally and environmentally superior.

Markets in bio-based research and innovation services create advantages for SMEs and startups. Focused firms with protected, specialized expertise are the feeder system for industrial plays in the bioeconomy, with the broader scope of knowledge at the RTOs proving less important.

Value chain formation creates Little Space for RTOs – the institutes are not needed as a facilitator and the commercial drivers of value chains do not per se generate incremental innovation needs as new players get involved. RTOs struggle to expand their client base.

Scenario Pathway 9: Efficiency Engines

20151214 Efficiency Engines

In this pathway, the dominant logic is that of Resource Utilization, and RTOs work with industries to maximize the valorization of raw materials and waste and the efficiency of existing capital assets.

At the level of concrete action, the dominant green paradigm is Reduce, Re-use, Recycle, and in the bio-economy RTOs find themselves working ‘outwards from the middle.’ Starting with the focus on the valorization of industrial side-streams, the RTOs over time increase research into both the recyclability of bio-based products and the reduction of resource requirements through new circular business models.

The political expectation for RTOs is that they serve as the Workhorses of the bioeconomy, tackling challenges related to process design, energy and water efficiency, and systems integration that prove difficult for individual companies, since they require long research, development and demonstration cycles and successive incremental improvements.

To achieve this, innovation policies create a Partnership Context for work on the bioeconomy, with RTOs and industry jointly influencing national bioeconomy agendas. RTOs are virtually embedded in the bioeconomy work that large industry undertakes.

The dominant technological paradigm for RTOs is Process and Systems Optimization. With political focus on extracting value from assets, RTOs can afford to take address incremental improvements in energy and resource efficiency and process intensity.

The markets for innovation services in this pathway are less competitive, and create Advantages for Insiders including, in this case, RTOs. The exception is in software development, where industry works with small private firms more regularly than RTOs.

In this pathway, value chain formation is centred around large, incumbent companies, and as such RTOs face a Stable Context for their ongoing work in the bioeconomy.

Market analysis: Products from Lignin

(Written by Jesse Fahnestock (SP) based on analysis by Ileana Hernandez Mireles (TNO) and Henna Sundqvist-Andberg (VTT))

The AERTOs Bio-Based Economy project has begun working to evaluate business cases for select process–>product routes for ligno-cellulosic biorefineries. A first, rough assessment of the economics of these cases has been performed, with more detailed techno-economic analysis of the processes now under development. From a product perspective, all of these cases assume a production of C5 and C6 sugars (volumes dependent on process) and a valorization of the lignin fraction. The project’s market studies and innovation systems analysis team has already looked at some issues related to sugar markets (here and here); the following post provides a brief summary of some of the potential markets for lignin-based products.

Several of the routes involve the production of guaiacol, which is the primary feedstock in industrial vanillin production. Vanillin is a valuabe product in flavourings, fragrances, in agrochemicals and as a pharmaceutical feedstock, commanding up to $12 000/tonne. The potential to produce vanillin from lignin has been understood for decades, but the mismatch between the small market volumes and the scale of lignin side-streams has been a disincentive. The problem remains today – 20% of the total market volume (16 000 tonnes/year) is based on Lignin, but this is all from one company (Borregard).

20151219 Vanillin

The routes generating guaiacol can also produce phenolics. As a chemical feedstock these command a lower price of approximately $1500/tonne but the global market of around 8 million tonnes is large and expected to outgrow the economy as a whole. Derivatives such as resins are seeing similar market growth. Another higher-value alternative may also be the production of Bisguaiacol-F, a potential replacement (somewhat controversial) plastics precursor BPA.

20151219 Phenolics

While the integrated techno-economic analysis for these routes has not been complete, a preliminary back-of-the-envelope calculation suggests that vanillin revenues are required for a robust business case. As it is unclear that the vanillin market could grow sufficiently to absorb new lignin-based production, the alternative route, focusing on the production of polyelectrolytes that could potentially compete with fossil-based polyacrylamide as a flocculant. The largest market for such flocculants is wastewater treatment; prices of flocculants are typically around $3000/tonne at production volumes of 2 MT/year. Lignin-based polyelectrolytes have not yet entered this sector and their performance needs to be verified, but the preliminary case appears attractive.

The following image summarizes the prices and volumes of these products.

20151219 Lignin Products

(Prices per tonne for phenolic resins were based on an unweighted average of three cited price ranges and the physical volume based on this average and the cited 2012 market volume of USD 9,19 billion.)

The following table summarizes some of the market issues related to these products.

20151219 Lignin Products Market Issues


Europe and the Bioeconomy

(A continuation from the AERTOs BBE Forward-Looking Analysis. For background, see Bioeconomy: The Scenario Pathways)

Scenario Pathway 4: Green Agenda

20151214 Green Agenda

In this pathway, the dominant logic is that of Environmental Sustainability, meaning that Europe views the bioeconomy as part of the transition to a more environmentally sustainable economy, due to its potential to contribute to reduced fossil fuel consumption, greenhouse gas emissions, and waste.

The working green paradigm is one of Think Globally, Act Locally, which means that the European bioeconomy is expected to help solve global environmental problems, both by reducing Europe’s own global environmental footprint and through the maintenance of high standards for what constitutes sustainable bio-based business.

The  politics of the European bioeconomy are focused on Keeping Promises, i.e., delivering on Europe’s high-level environmental targets. Tensions between environmental and economic objectives are not resolved, but commitments made to targets are seen as politically credible and the bioeconomy is positioned as a tool for meeting ambitious CO2 reduction, renewable energy, and waste reduction targets by 2050.

Policies aim to Incentivize a Fossil phase-out. With much of the energy sector on track to phase out fossil fuel use by 2050, the emphasis for the bioeconomy after 2030 is on replacing fossil feedstocks in process industries and manufactured goods. Product standards (for both CO2 and renewable content) and carbon taxes are the primary policy tools.

The dominant technological paradigm for the European bioeconomy is Substitution at Scale. Technologies that allow for bio-based solutions to enter the economy through large-scale infrastructure akin to that of the ’fossil economy’ are dominant. For fuels and chemicals this means that strategies that involve blending through existing infrastructure are prioritized initially until new infrastructure is economically justified by very high marginal CO2 prices after 2035.

Markets treat this large-scale substitution strategy as Bankable and respond with large-scale finance. The perceived robustness of policy frameworks and infrastructure used by the bioeconomy by 2030 makes the sector attractive to both industrial balance sheet investors and project financiers.

Value chain formation occurs initially through Clusters to overcome uncertainty about economic and environmental value creation. Over time, the increasing bankability of bio-based alternatives leads to larger investors and industrials scaling up in both vertically integrated and disaggregated approaches.

Scenario Pathway 5: Bio Boutique

20151214 Bio Boutique

In this pathway, the dominant logic is that of Competitive Innovation, and Europe sees the bioeconomy as an arena to develop competitive advantages vis a vis other countries and regions, based on advanced technological capabilities.

The working green paradigm is once again Clean Tech, with the European bioeconomy positioned as a cutting-edge industrial movement creating products  with both green benefits and advanced functionality. Green consumerism is an established and large market segment that includes bio-based alternatives and Europe sees itself as a pioneer of bio-based processes and products.

The politics of the European bioeconomy are most interested in Export Promotion. Political favour is given to concepts that may have advantages in global markets. The bioeconomy is expected to be fast-moving and dynamic and political support follows technological trends.

In terms of Policies, this strategy encourages European countries to create Domestic Lead Markets, usually through public procurement and tax advantages. These programmes require resolution with trade and competitiveness rules, leading to uncertainty that undermines their breadth and scope. However sufficient exceptions are carved out to support a number of pioneering companies.

Capturing investor interest in the European bioeconomy and competing on global markets requires a technological paradigm based on Patentable IPR. Companies patent process technologies and product designs aggressively, and benefit from increased harmonization in patenting in the EU, itself driven in part by the ’Clean Tech Race’ at the global level.

Markets in the European bioeconomy develop in ways that favour First Movers. Bio-based innovations attract more venture capital than in other scenarios and investors see major advantages to reaching early adopters, participating in procurement programmes, and creating strong brands for bio-based alternatives. Early movers in process technologies look to export patented solutions based on enzymes, catalysts, and genetic modification as well as a number of advanced materials applications and turnkey industrial systems.

Value chain formation occurs at Arm’s Length, with the companies with the greatest technical and IPR base wielding the greatest negotiating power and capturing the highest margins.

Scenario Pathway 6: Bio Leverage

20151214 Bio Leverage

In this pathway, the dominant logic is that of Resource Utilization, and the countries of Europe take different approaches to the bioeconomy, each looking to leverage their own natural resource and industrial bases.

The working green paradigm is the Circular Economy, and the bioeconomy in Europe is at first considered by many as an ’inherent’ part of this paradigm, since biogenic resources are part of nature’s closed loops. Over time however more pressure is put on the bioeconomy to increase its own ’circularity’, through industrial symbiosis and improved durability and recyclability of its products.

In Europe the politics of the bioeconomy are based on Strategic Assets, and those countries most active in the bioeconomy pursue something akin to industrial policy in the sector. Political priorities include promoting the sustainable exploitation of natural resources (sometimes against green opposition) and protecting jobs in strategic industries (sometimes against disruptive forces).

Domestic Policies in the European bioeconomy thus incentivize the Supply-Side of the bioeconomy. While more direct strategies at the national level risk conflict with competition rules, Member States are able to make use of European environmental strategies to promote both particular feedstocks (forest and agro-waste, especially) and subsidize the integration of key industries into the bioeconomy through support for demonstration, scale-up, and efficiency improvements.

As at the global level, the dominant technological paradigm of the European bioeconomy is that of Closed-Loop Systems. The primary variant of this paradigm is industrial symbiosis, and the bioeconomy becomes the pre-eminent practitioner of this model of integration between industries. Recycling of end-of-life products, especially those based on wood fibres, is a smaller but steadily growing element of the circular bioeconomy.

The political and technological dynamics limit the availability of capital, and as such the focus of financial markets and industrial competition is Return on Assets. Innovation and the growth of new markets become less important than efficiency and market share.

In this pathway, value chain formation produces Integrated Champions of the bioeconomy, with feedstock, processing, and brand ownership often controlled by large, integrated incumbents. In Nordic and Southern European countries the agro, forest and pulp and paper sectors forward-integrate into chemicals, while the Central European chemical companies backward-integrate into raw materials.

The World and Sustainability

(A continuation from the AERTOs BBE Forward-Looking Analysis. For background, see Bioeconomy: The Scenario Pathways)

Scenario Pathway 1: Our Common Future

20151214 Our Common Future

In this pathway, the dominant logic is that of Environmental Sustainability, meaning that sustainable handling of natural resources, protection of ecosystems, and reduction of undesirable human impact on the biosphere are the main priorities of global approaches to sustainable development.

The working green paradigm is one of Earth Systems Solutions, which means that environmental problems and the attendant solutions are put in a global systemic context. Environmental activists describe threats to the health of the planet and seek large-scale, long-term solutions based on global collective action.

In the absence of true global governance, the global politics of sustainability must therefore seek Incremental Collaboration, negotiating through existing vehicles such as the UNFCCC, WTO and other trade agreements. Complete top-down solutions remain elusive and these negotiations are more successful at generating international convergence and a cooperation between national approaches to sustainability.

Policies thus aim to create Shared Incentives, both between nations and across sectors of the economy. The emphasis is on economic instruments, especially those that put prices on environmental externalities.

In response to the search for large-scale, global solutions, the most important technological paradigm is one of Affordability and Transferrability. Technologies that can reduce environmental impact and replace fossil fuels in the greatest volumes, at the least cost, and in the most contexts globally are in demand and are the focus of research, development and innovation efforts.

Markets for these technologies deliver Price Convergence, driving the value of greenhouse gas reductions, saved water and other ’sustainability goods’ together by working at scale across borders and across sectors.

Value chain formation creates Global Efficiencies, with large companies stitching together value-add and deploying according to advantageous conditions across from multiple countries and sectors to minimize the costs and reach of sustainability-products and services.

Scenario Pathway 2: The Clean Tech Race

20151214 Clean Tech Race

In this pathway, the dominant logic is that of Competitive Innovation, as countries and global companies approach sustainable development as a challenge which will produce winners and losers, with innovative capacity the determining factor.

The working green paradigm is one of Clean Tech and Leapfrog, as novel technological and social innovations are seen as the key to addressing environmental problems while creating win-win situations for business and the economy. Action on the environment is viewed as modernizing and countries see themselves in a ’race’ to develop green solutions.

In this competitive environment, the global politics of sustainability are focused less on common benefits and more on securing Exemptions and Advantages for countries and their preferred strategies. Links and synergies between the strategies are pursued only when they are seen to generate economic or political benefits.

The resulting policies create a Tangled Web, both of trade and regulations. Market-making tools such as subsidies and preferred purchase programmes are common, and some tariffs are used defensively.

The emphasis on competitive advantage means that the technological paradigm of sustainable development is Targeted and Proprietary. Companies and research institutions seek to develop highly differentiated innovations, and to protect both the intellectual property and market positioning.

Markets for these technologies, products and services deliver Green Premia, either via the aforementioned policy instruments, first-mover advantages, or marketing and branding.

Value chain formation attempts to create and preserve High-Margin Niches. Brand and technology owners use bargaining power to capture as much of the aforementioned premium as possible. Supply chains tend to be hard to replicate and overall dissemination of a given solution tends to be less broad.

Scenario Pathway 3: Green Resource Nationalism

20151214 Green Resource Nationalism

In this pathway, the dominant logic is that of Resource Utilization, and global approaches to sustainability are built around maximizing efficiency and asset utilization, both in terms of natural resources and capital assets.

The working green paradigm is the Circular Economy, and the minimization, re-use, and valorization of waste are seen as the keys to reducing environmental footprint. Radical resource efficiency building on existing industries and technologies is seen as both green and strategic.

In this competitive environment, the global politics of sustainability see countries trying to achieve ’Sustainable Nation Status,’ with ambitious domestic strategies competing with one another for political and industrial prestige. International relations on sustainability are less collaborative and more akin to a ’Top-Runner’ arrangement.

Domestic Policies focus on Supply-side Security, with rules, trade, and subsidies promoting sustainable domestic feedstocks. Industrial policy, including targeted R&D initiatives, seeks to maximize the value of existing industrial assets and facilitate industrial symbiosis rather than looking to create new markets.

The technological paradigm most associated with this logic is that of Closed-Loop Systems. Zero-waste approaches come to dominate in process and manufacturing sectors and the system perspectives expand over time to incorporate consumers, both through advanced end-of-life recycling and upcycling and through new business models focused on function and service rather than product ownership.

For both industry and consumers, these markets are valued for their cost-certainty. Waste valorization reduces exposure to volatile feedstock and raw material prices, and an increase in leasing and subscription-based consumption gives consumers mores table expenditure over time.

Under these conditions Value chain formation produces Islands of Efficiency. Integrated companies, clusters, and even sectors of the economy pioneer specialized, deeply efficient approaches to production and consumption, but these solutions see limited dissemination globally and fail to systematically address economic and environmental externalities beyond their system boundaries.

Bioeconomy: The Scenario Pathways

The Forward-Looking Analysis portion of the AERTOs Bio-Based Economy project seeks to develop contextual, exploratory analysis that helps the participating research institutes better evaluate their bioeconomy strategies. The general approach has been to build up a framework for thinking about the future and to consult with stakeholders to identify potential issues of particular importance  and discuss how they might play out. The analysis takes a 15-20 year perspective, near enough to be relevant to the research and development being done today, but far enough away to allow for a new bioeconomy regime or regimes to have emerged.

The first output of the analysis was the scenario framework, and associated ’pathway narratives’ below. In 2016, the project will also summarize possible ranges for key quantitative variables at the bioeconomy level, and dig deeper into four themes identified by project stakeholders.

20151214 Bioeconomy Pathways

The accompanying short texts are intended to explore the implications of the scenario framework. This framework looks at three different ’Dominant Logics’ over three levels, with their intersections creating nine ’scenario pathways.’ The narratives to follow explore these pathways across six ’framework conditions.’ These are speculative and are kept at a general level – the intention is not to produce in-depth, evidence-based scenarios for each pairing, but rather to give a sense of how this scenario framework could inform conditions for more specific scenarios.

The Scenario Pathways:

The Lignin business – what is the way forward?

Henna Sundqvist-Andberg, VTT

Discussions on business potential of lignin have come and gone over several decades. Is this an everlasting cycle or is there something revolutionary in the air?

Lignosulphonates have established they position in the markets for decades ago in several applications, including construction, food and feed ingredients, and bitumen. So far other types of lignin haven’t been able to compete in production volumes with lignosulphonates. Kraft lignin from pulp production has been the second largest commercial lignin type but production volumes and markets have been modest. Lignin business hasn’t been lucrative enough for companies, even though there could be several viable applications for lignin (Fig. 1). However, weak signals from the industry have become stronger. Anticipation and expectations are once again in the air.

20150822 Lignin business blog price vs. volume

In 2014 Stora Enso announced a biorefinery investment in Sunila Pulp Mill Finland which focuses on extracting lignin, “the green gold of the Nordic forests”, from pine and spruce kraft pulping process by utilizing LignoBoost recovery technology. According to Stora Enso the initial markets are anticipated in the construction and automotive industries, as a renewable and sustainable alternative to the phenols used in plywood and wood-panelling glues and the polyols used in foams. Similar kind of progress is taking place in Canada. West Fraser Mills is investing in LignoForce System™ lignin recovery plant together with its partners (AB Plywood, Ecosynthetix, FPInnovations, Hinton Pulp, and Quesnel Plywood). The company is planning to use lignin as an adhesive (phenol formaldehyde resin) for its plywood and engineered wood products.

What makes the situation different this time? The bioeconomy boom is going strong with public funding available for R&D, piloting and investments. Innovation processes are advancing into piloting stage (e.g. carbon fibre (Innventia and Oak Ridge National Laboratories) and bioaromatics (Biorizon, Biochemtex)). Separation technologies for kraft lignin are commercially available (LignoForce, LignoBoost, SLRP). Environmental sustainability has become more and more important for both consumers and companies.

Even though the recent progress has been positive the picture is still not that rosy. The first step has been the production of green substitutes, like phenol formaldehyde resins. Additional commercially viable applications are needed, and the industry needs to evaluate whether lignin-based chemicals are for niche applications or if they could fully substitute petroleum-based products, and build the appropriate value network and even markets. Lignin-based chemical producers need to provide right product properties, ensure the consistent quality, guarantee the supply security, and balance with oil price development. It does become clear why it has taken a long time to reach this point, doesn’t it?

Could this still be a tipping point for lignin business? It might be that for kraft lignin, but for other types of lignin (organosolv, hydrolysis etc.) it is likely to take several more years until these truly take off. Cellulosic ethanol production and solvent pulping are further away but are steadily developing, with several pilots (CIMV, Renmatix Plantrose, Lignol Innovations’ Alcell process for solvent pulping) and start-ups are running (e.g. Abengoa, POET/DSM, GranBio for cellulosic ethanol production).

So what is the way forward for the lignin business? Two steps forward and one step back? The recent oil price development certainly might curb enthusiasm but there is no denying that there are opportunities today, if the circumstances are right: the raw material is cost competitive and available, quality of the lignin is right, performance is reliable and sustainability is taken into account, Fig. 2.

What could be the next step forward? It has been said that the best way to predict the future is to create it – so let’s continue developing new business from lignin in collaboration with the industry.

20150822 Lignin business success factors

Figure 2. Critical success factors for lignin business

20150822 Lignin business future markets

Fig. 3. An overview of prospective lignin markets.